
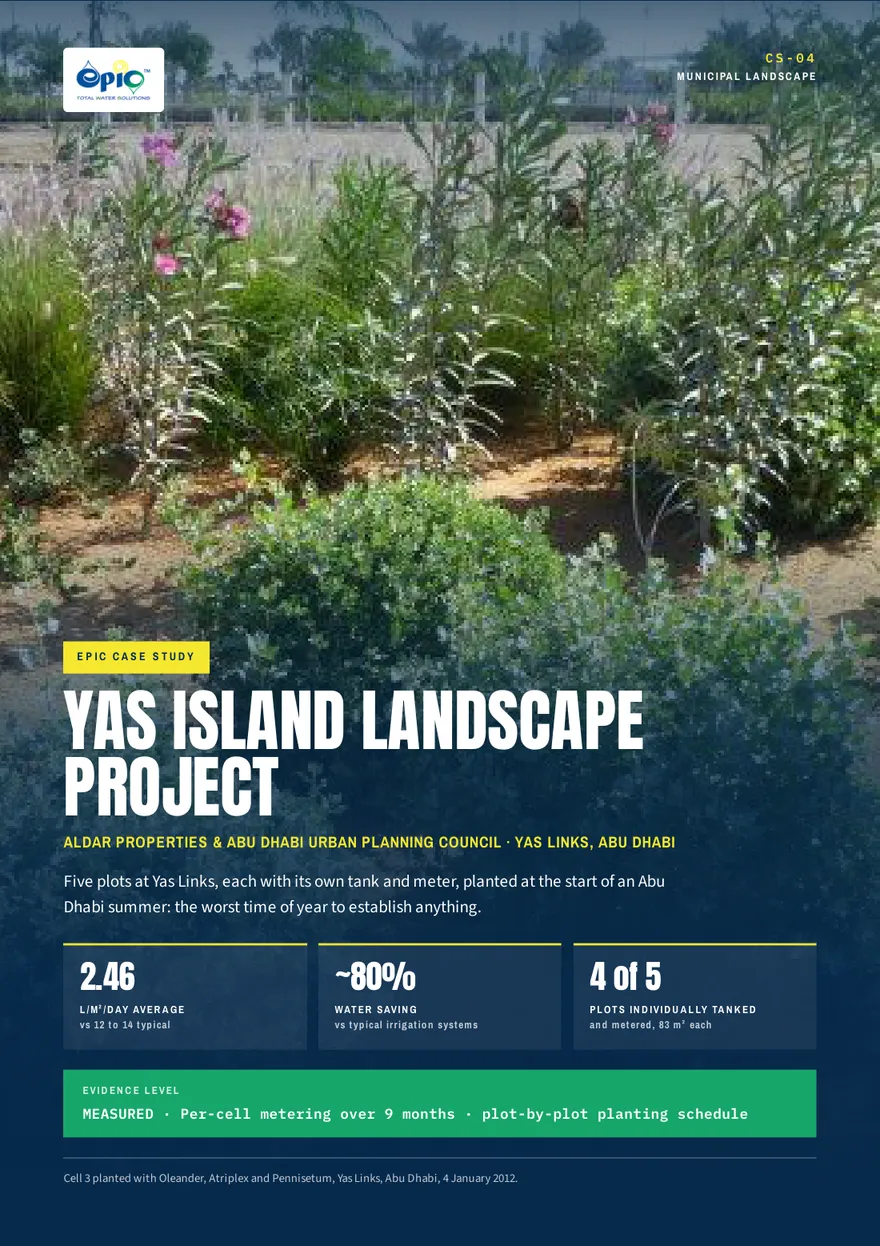
Project case study · CS-04 · Municipal landscape
Yas Island Landscape Project
Aldar Properties and the Abu Dhabi Urban Planning Council · Yas Links, Abu Dhabi. Five plots, each with its own tank and meter, planted at the start of an Abu Dhabi summer.
- Reference
- CS-04
- Edition
- 2 · September 2026
- Format
- PDF · 6 pages · 3.3 MB
- Access
- Open
About this case study
Five self-contained trial plots at Yas Links, built in February and March 2011 at the invitation of Aldar Properties and the Abu Dhabi Urban Planning Council.
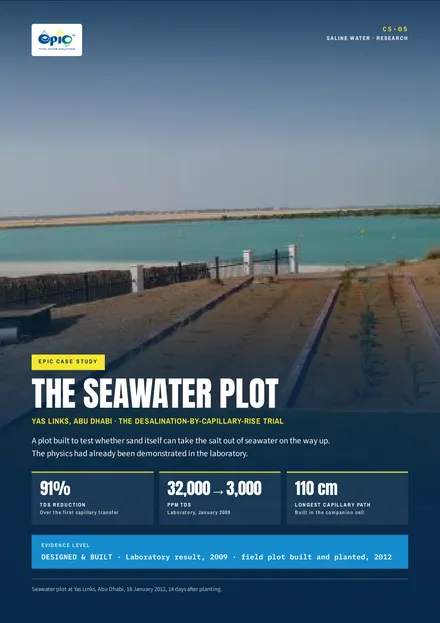
Four of the plots were individually tanked and metered, so that water use could be recorded separately for shrubs, groundcover and turf. Two ran on potable water and two on treated sewage effluent. The fifth sat near the sea and was supplied with seawater by a solar-powered pump.
Yas Island has a high water table, and seawater rises into conventionally landscaped ground by capillary action. The sealed EPDM liner keeps it out of the EPIC profile.
The plots were planted at the start of an Abu Dhabi summer, the hardest time of year to establish anything. The six-page case study sets out the project record, the metered consumption and the dated photographs from bare ground in February 2011 to a second Gulf summer in August 2012.
Project record
- Invited by
- Aldar Properties and the Abu Dhabi Urban Planning Council
- Location
- Yas Links, Yas Island, Abu Dhabi, United Arab Emirates
- Installed
- February to March 2011
- Scope
- Five plots of 83 m² each; four with individual tanks and meters. Four smaller tree plots added on the same basis.
- Water sources
- Two plots on potable water, two on treated sewage effluent, one on seawater via a solar-powered pump
- Planted
- Three plots with typical UAE landscape planting on 26 April 2011; the fourth with Platinum TE Paspalum turf, grown from seed, on 15 May 2011
The measured record
Per-cell metered consumption, litres per m² per day, as summarised on 29 January 2012.
| Period | Cell 1 | Cell 2 | Cell 3 | Cell 4 | Average |
|---|---|---|---|---|---|
| 26 Apr 2011 to 23 Jan 2012 | 3.66 | 2.00 | 2.33 | 3.10 | 2.77 |
| 2 Nov 2011 to 23 Jan 2012 | 2.38 | 1.62 | 1.81 | 2.95 | 2.19 |
Date palms: 73.9 litres per tree per day from April to January, and 11.67 from November to January.
The first five months, litres per m² per day, as first published.
| Period | Plot 1 | Plot 2 | Plot 3 | Plot 4 | Average |
|---|---|---|---|---|---|
| First five months | 3.63 | 1.80 | 1.99 | 2.44 | 2.46 |
Plot and cell numbers follow the original tables. Against the 12 to 14 L/m²/day typical for the area, the case study states the result as a saving of approximately 80%.
Also on the record
The Paspalum plot was grown from seed inside the system, which is rarely attempted in the UAE because seed must be kept moist without drying out before it roots. The trial drew visits from government, media and private organisations, with coverage in Construction Weekly, AME Info, MEED, Al Fajr, Zawya and Gulf Today.
From bare ground to a second summer
Fourteen dated photographs from the site record, in the order they were taken. Elapsed time is counted from the 26 April 2011 planting date.
February to April 2011Building it
-
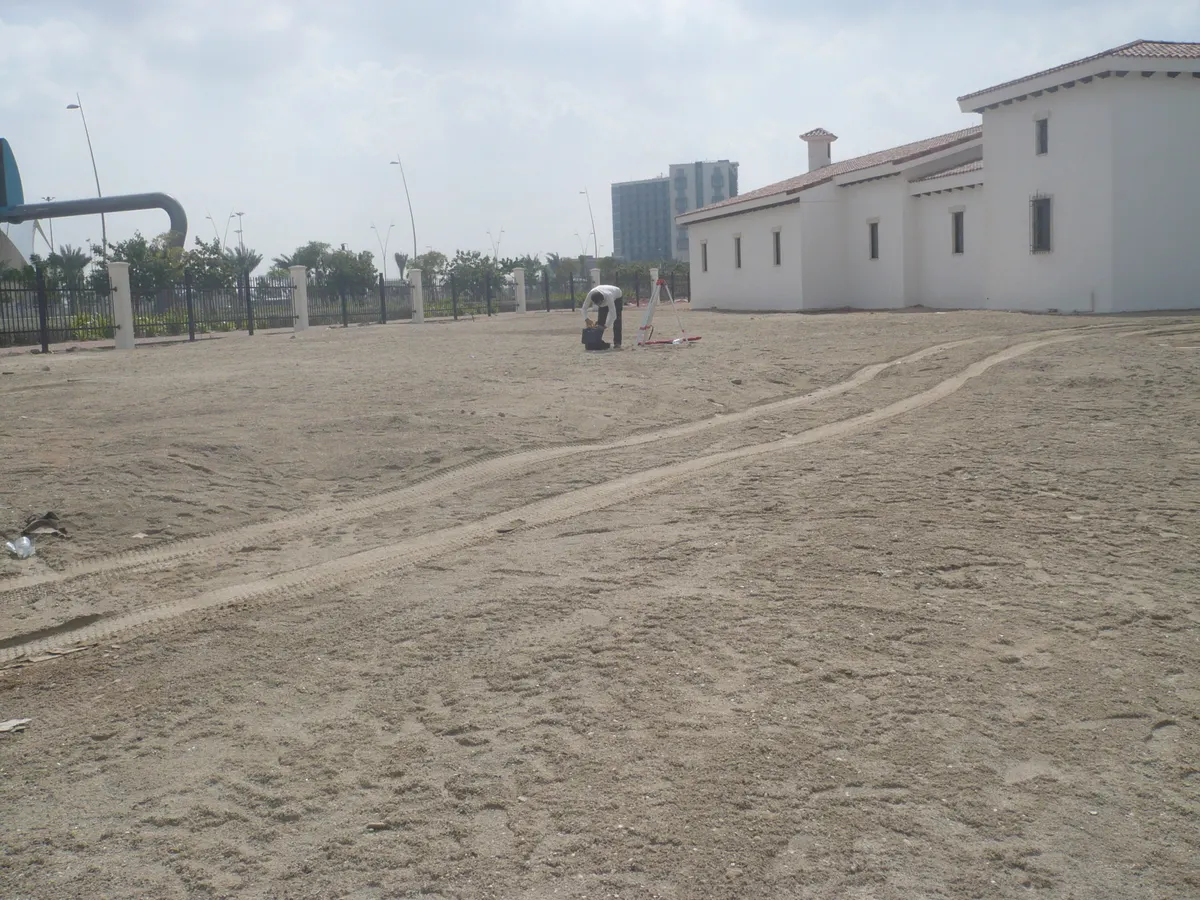
01 3 February 2011BeforeThe graded lot beside the clubhouse before any work. -
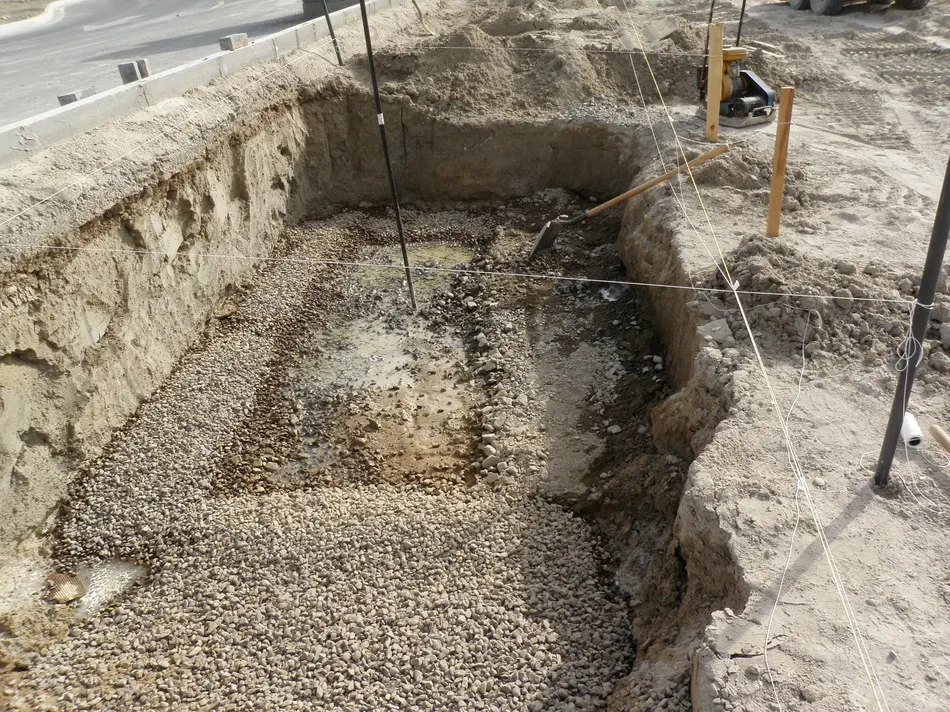
02 27 February 2011ExcavationThe excavation opened and brought to level, gravel base in, string lines set. -
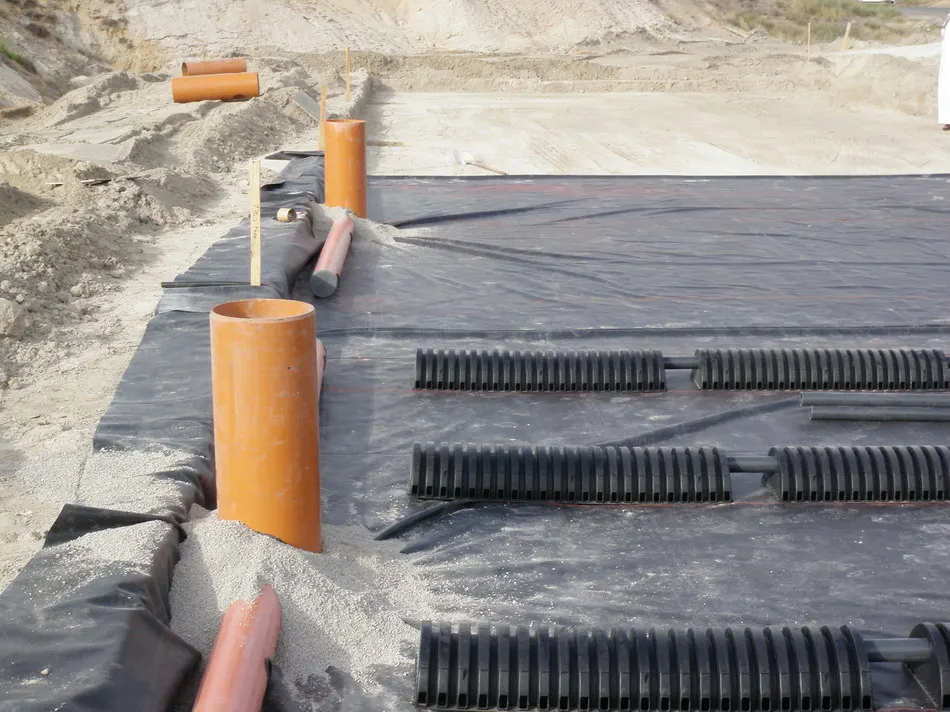
03 1 March 2011ChambersEPIC chambers laid on the geomembrane liner, riser pipes standing at the connections. -
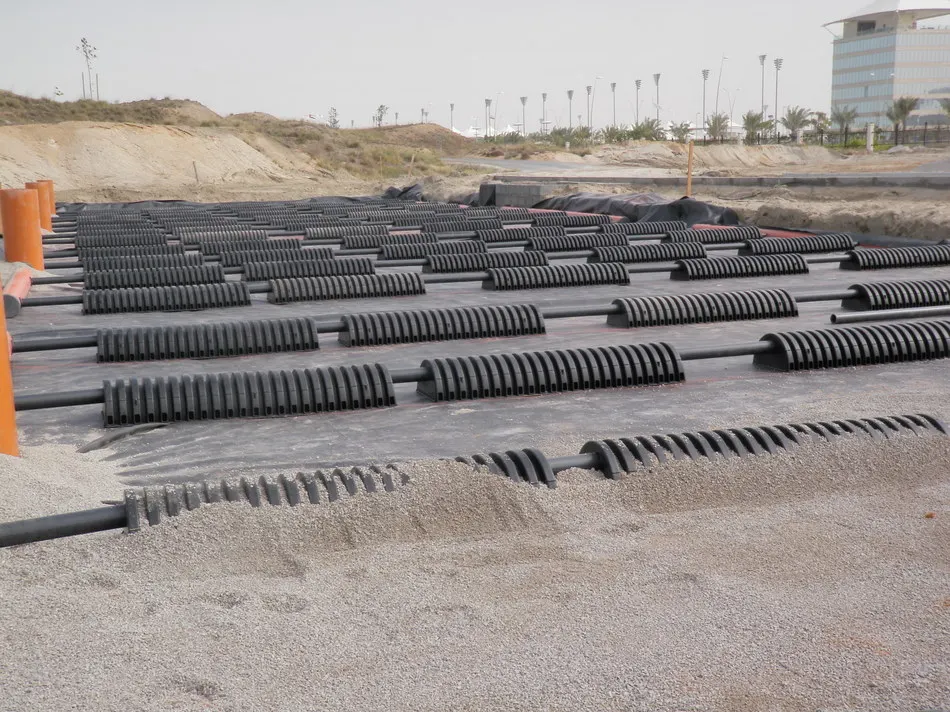
04 2 March 2011The arrayThe array complete across the plot, ready for cover. -
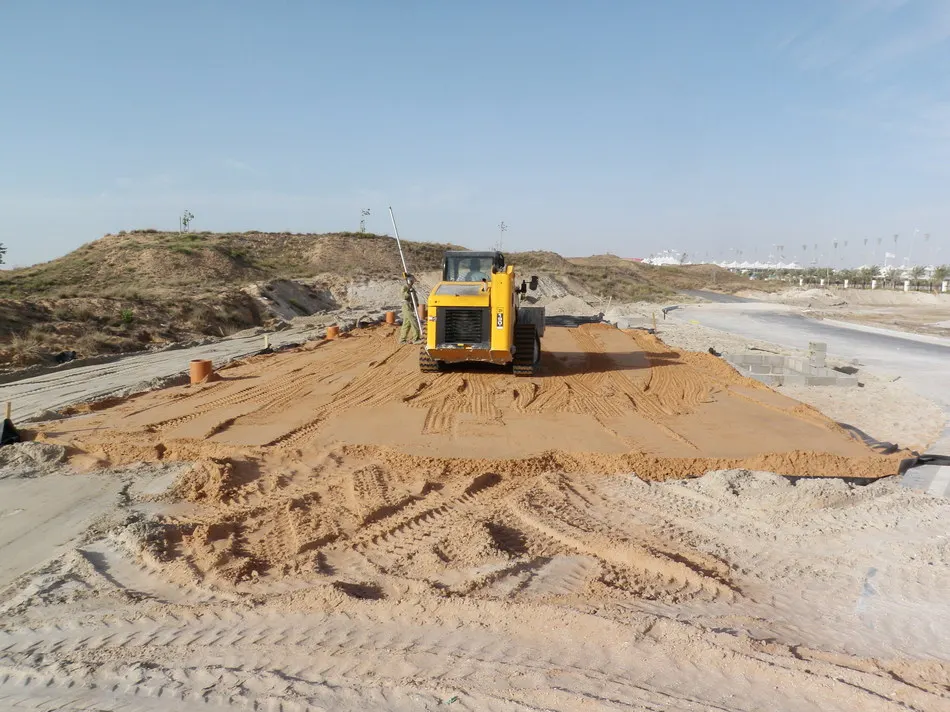
05 2 March 2011SandSand spread over the gravel to form the profile the roots grow into. -
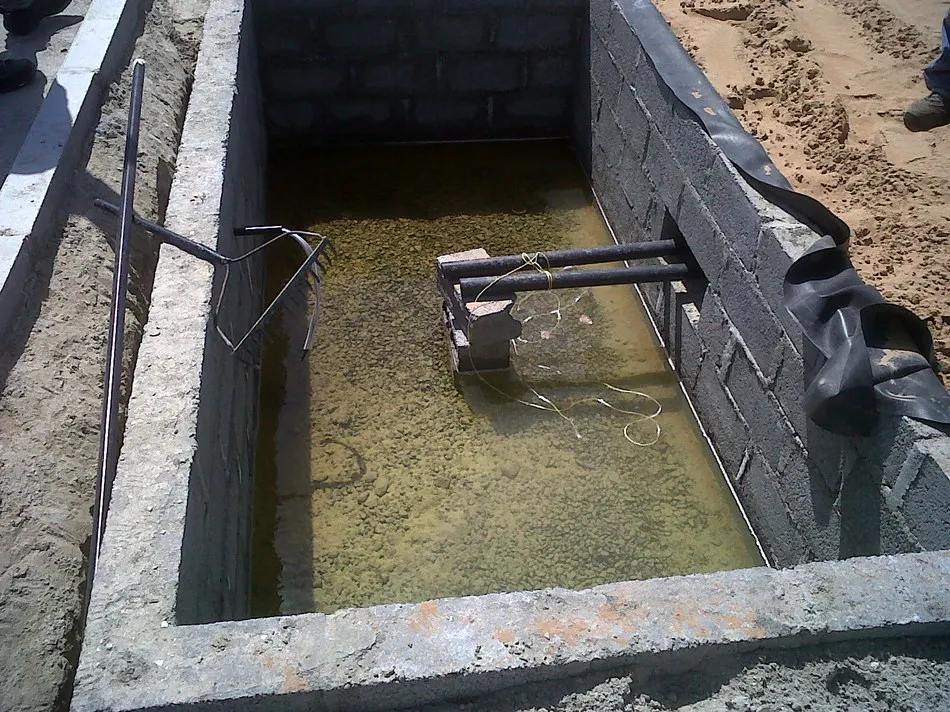
06 3 March 2011Water testThe control chamber charged and standing full, tested before backfill. -
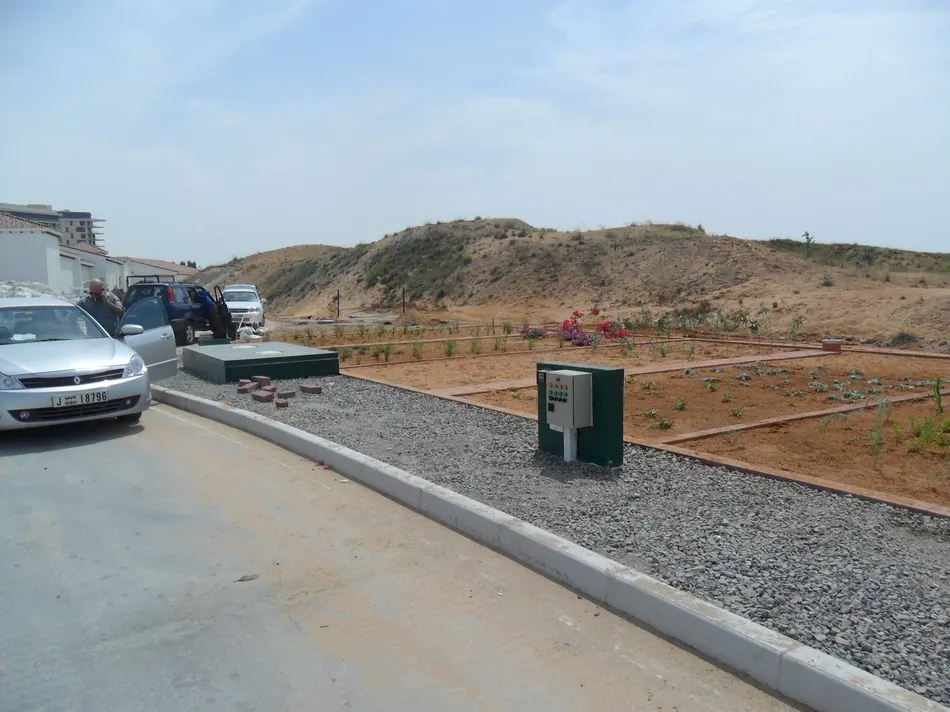
07 26 April 2011ReadyThe finished plots with the control panel in place, on the planting date.
May 2011 to August 2012Growing it
-
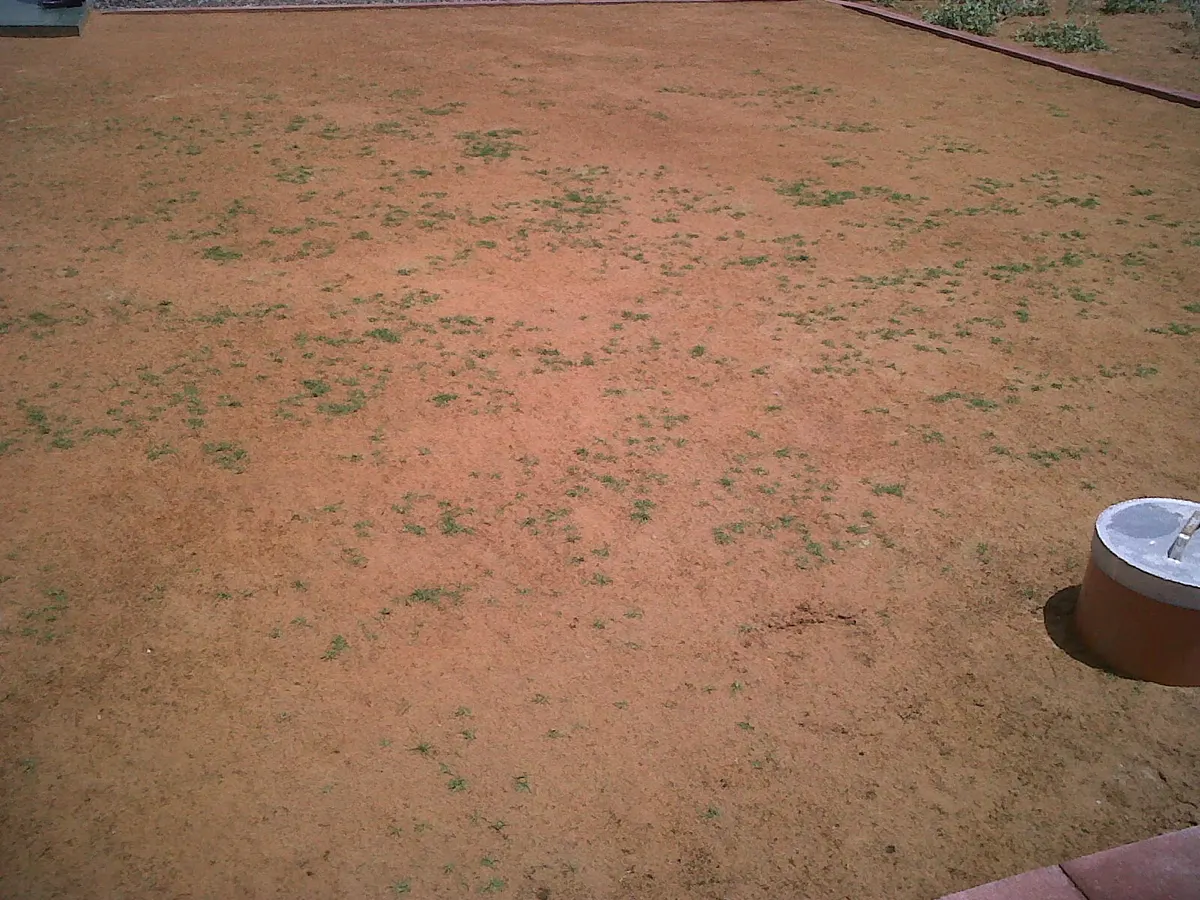
08 22 May 2011Turf sownTurf establishing on raw sand a week after sowing, a chamber access cover at the edge. -
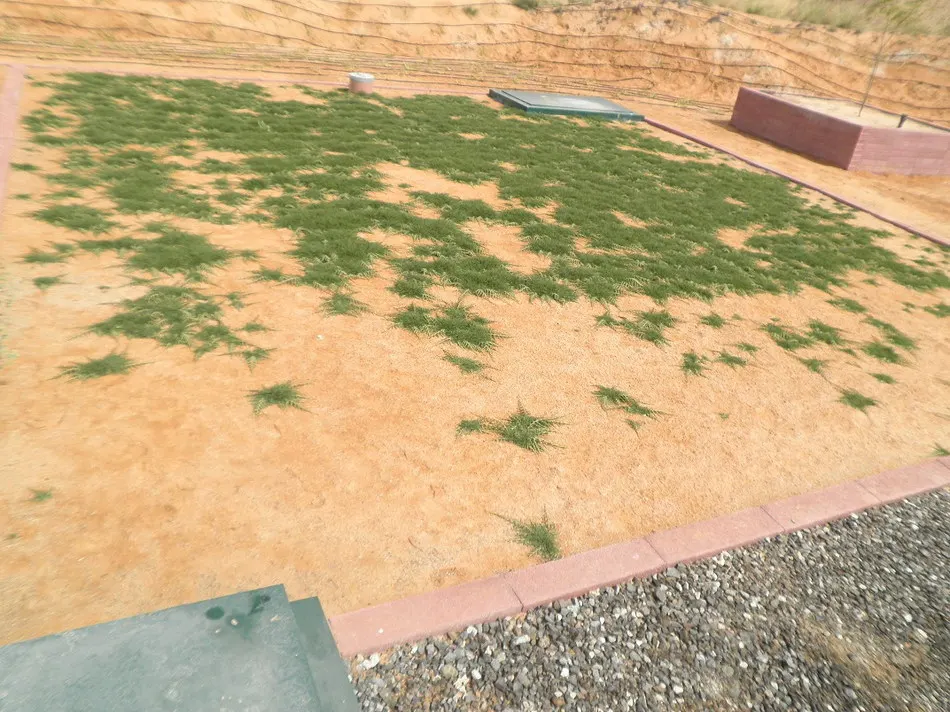
09 19 June 20118 weeksGroundcover taking hold across the cell. -
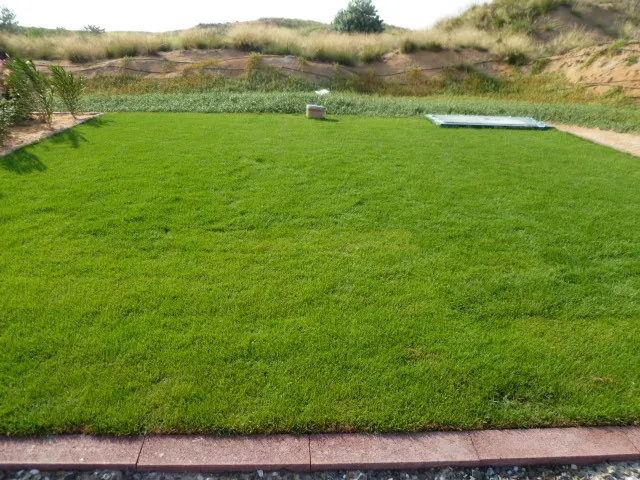
10 3 October 20115 monthsThe lawn cell fully established, edge to edge. -
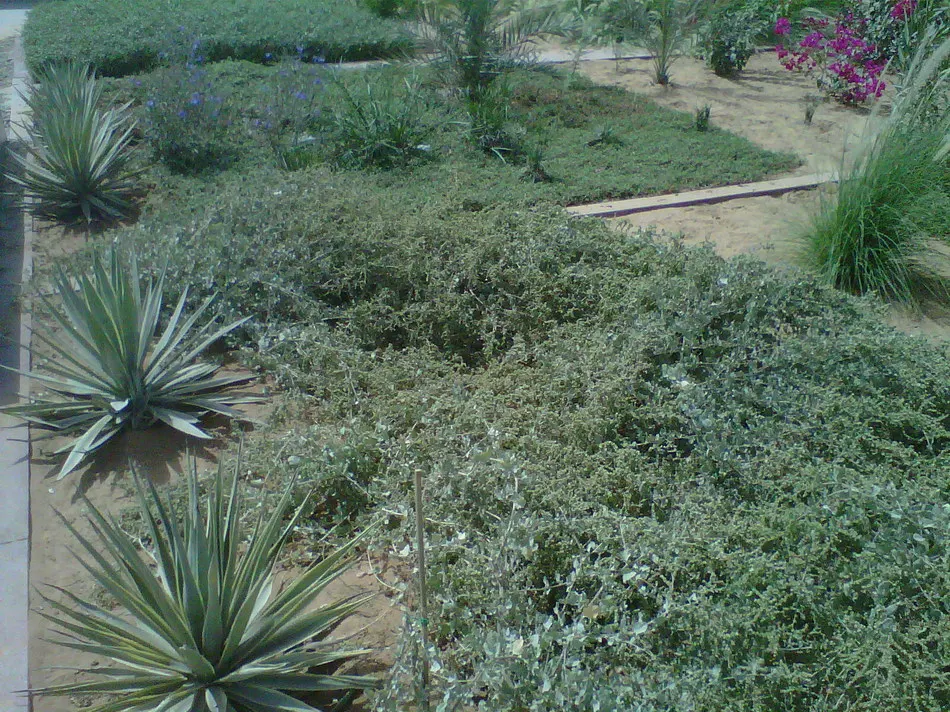
11 6 October 20115 monthsShrub and groundcover beds closed over, agave and yucca through. -
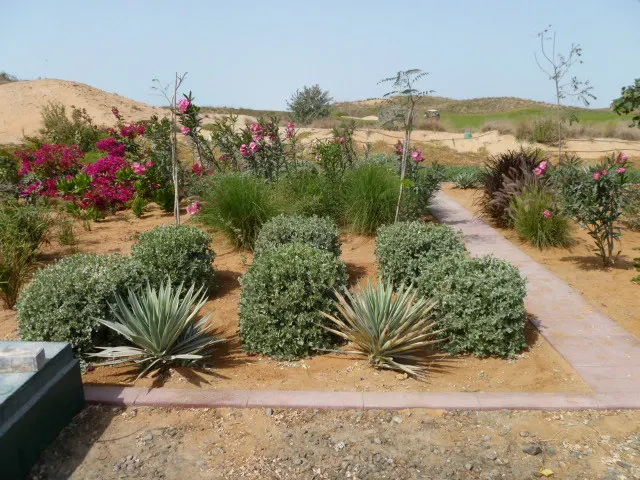
12 12 February 20129 monthsBougainvillea in flower, oleander and yucca established along the path. -
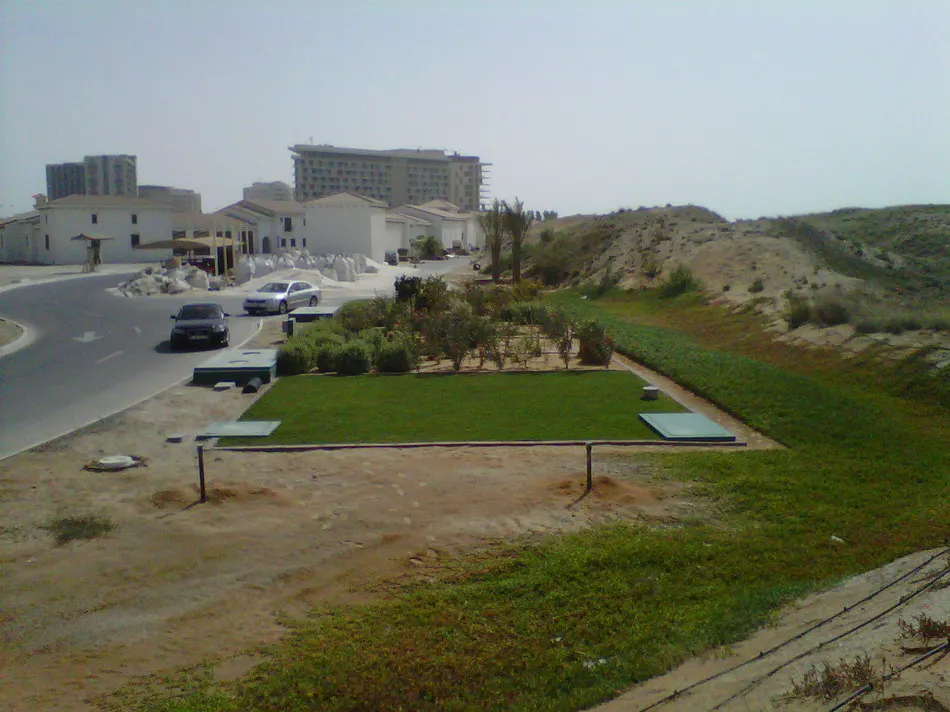
13 12 March 201210 monthsThe plot in its setting: mown lawn and chamber lids, with the road beyond. -
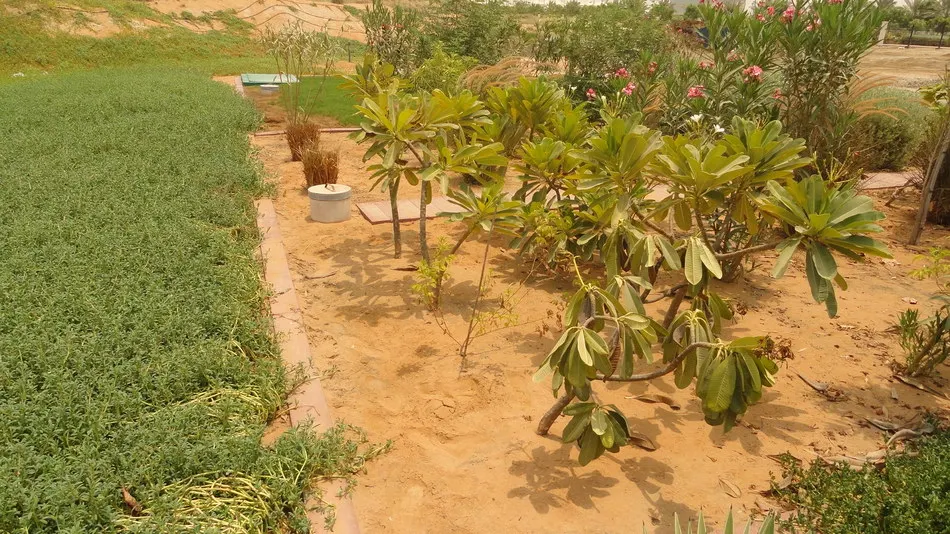
14 1 August 201215 monthsFrangipani and oleander over dense groundcover, through a second Gulf summer.
Read it with

Applications Compendium
Every application, from irrigation and stormwater to greywater, blackwater and bioremediation, with accepted water sources and design notes.
On request75 pages
Working on a project? Send us the drawings, the bill of quantities or the question.
Talk to usPublished by EPIC Total Water Solutions LLC, Reno, Nevada. Issued in the Middle East and North Africa by Xpitrade General Trading LLC.